Electronic Medical Record (EMR) system is a multi-disciplinary high-tech project such as digital technology, computer technology, communication technology, software engineering, graphic image synthesis technology. Its complete data, data processing, network transmission, medical support, statistical analysis, etc. are unmatched by paper medical records.
Body temperature is an important data in the electronic medical record system. For example, an elevated patient's temperature can let the clinician know that the patient has symptoms of fever. In the electronic medical record system, the user for the body temperature list is the nurse of the hospital. The nurse records the patient's body temperature and other information every day, and enters the database. The system automatically generates an electronic body temperature sheet and draws a graph. The body temperature curve visually displays data about the patient's body temperature, which, combined with knowledge about the disease and treatment, can serve as a basis for further diagnosis and identification of treatment options.
The electronic medical record system that the author participated in the development is based on the actual needs of a large hospital, and is developed in C# language throughout the .NET platform. This article focuses on the design and implementation of body temperature curves in electronic medical record systems.
1 The main function of the electronic medical record system
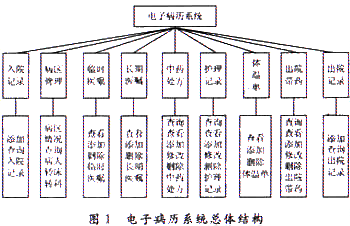
According to the actual needs of the hospital, the main purpose of the system is to collect patient data so that it can provide the clinician with the required diagnosis and decision information. Further aim is that the information can be used for clinical research. The main functions of the system are shown in Figure 1.
This article refers to the address: http://
2 Design and implementation of body temperature curve
2.1 Generation of the thermometer
In the electronic medical record system, each patient who comes to the hospital will have a medical record number during the hospital visit. This is the identification code that identifies the patient and is usually used as the only corresponding code and keyword in the database system. After the patient is in the hospital, the nurse performs tests on the patient's body temperature, pulse, and breathing. The data is entered into the electronic medical record system, and the system automatically generates a body temperature list.
In the patient's temperature list, the patient's temperature change needs to be recorded and analyzed. The three items of "body temperature", "pulse", and "breathing" of the body temperature information are recorded once every 4 hours, at 4 o'clock, 8 o'clock, 12 o'clock, 16 o'clock, 20 o'clock, and 2 o'clock. Several time periods. The information such as "number of stools", "number of urination or amount", "capacity", "discharge amount", "blood pressure", "weight" are recorded once a day. According to the body temperature single message, the curve of "body temperature", "pulse" and "breathing" of the patient in each time period in one day is plotted, and the number of stools and the number of urination recorded are recorded. Information such as quantity, intake, discharge, blood pressure, and weight. The entire body temperature map shows only 7 days. In the body temperature map, the coordinates and curves are used to describe the continuous changes of the patient's body temperature, which intuitively meets the nurse's need to enter and query the patient's body temperature, breathing, pulse and other information. Figure 2 is a body temperature single display interface.

2.2 Drawing of body temperature map
The body temperature map is automatically generated based on the data of the body temperature sheet. Since the body temperature map only shows the patient's body temperature change for 7 days at a time, the function of turning the page is designed. For patients who have been hospitalized for a long time, the patient skips the page for 7 days, ensuring the complete display of the patient's body temperature information.
2.2.1 C# GDI+ drawing
The rendering of the thermogram is implemented by a GDI+ consisting of a .NET base set that can be used to perform custom drawing on the screen, send appropriate instructions to the graphics device driver, and ensure that the correct output is displayed on the display screen. .
In GDI, the way to identify an output device is to use a target device environment (DC). This object stores information about a particular device and can translate GDI API function calls into instructions to be sent to the device. The function of drawing is to use GDI+ drawing technology. Perform drawing operations by overriding OnPaint(PaintEventArgs e) in the Form class.
In OnPaint(), the Graphics object is first referenced from PaintEventArgs to draw the graph. Finally call the base class's OnPaint() method.
On the first start of the application, the first time the window is displayed, OnPaint() is also called, so there is no need to copy the drawing code in the constructor.
Since the whole body temperature map is relatively large, and the display window is set to 800×600, in order to display the body temperature map document completely, it is necessary to display a scroll bar on the right side of the notification window when the document exceeds the window. To do this, set the entire document area to (800,1 886) pixels and set the AutoScroll property to True in the properties of the Form Designer. This way, the scroll bar automatically appears when the temperature map exceeds the window.
2.2.2 Transformation from absolute coordinates to relative coordinates
In general drawing code, no special attention is required since the drawn graphics area generally does not exceed the size of the window. The Graphics instance interprets the coordinates as relative to the window by default, and it does not know about the scrollbar. When the user swipes the scroll bar, Windows does not require the application to redraw the content already displayed on the screen. Windows only indicates that the content currently displayed on the screen can be smoothly moved to match the position of the scroll bar. For the extra part of the document, this part of the window is not drawn when the application is first displayed, because this part is outside the window area before scrolling the window. This means that Windows requires the ScrollShapes application to draw this area. It will raise the Paint event, and use this area as a cut rectangle, which will be displayed together with the original graphic in the window. This will cause multiple graphics overlap in one window, which will cause the graphics to be confused.
The solution is to represent the default coordinates of the Graphics instance as relative coordinates, that is, the coordinates are relative to the upper left corner of the window, not the upper left corner of the beginning of the document, and the absolute coordinates are converted to relative coordinates. This conversion is illustrated here with Figure 3.
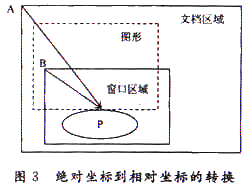
The solid rectangle marks the border of the screen area and the border of the entire document. The dotted rectangle marks the rectangle and ellipse that you are trying to draw. P marks a random point to draw. When the drawing method is called, a Graphics instance and a vector from point A to point P are provided, and the entire vector is represented as a Ponit instance. What is actually needed is a vector from point B to point P. The problem is that here only the vector from point A to point P is known, which is the coordinate of P relative to the top left corner of the document, but to the point P of the document. Also know the vector from point A to point B, which is the distance of the scroll, which is stored in an attribute AutoScrollPosition of the Form class. To know that the vector from point B to point P only needs to perform vector subtraction. The TranslateTransform method of the Graphics class can perform the calculation of these vectors. Here it is passed horizontal and vertical coordinates, representing the vector of the window's upper left corner relative to the top left corner of the document (AutoScrollPosition property, which is the vector from A to B in the figure), and then the Graphics device considers the window area relative to The location of the document area, which is processed. Just add the following statement to the drawing code: g.TranslateTransform(this.AutoScrollPositiort.X,this.AutoScrollPosition.Y); to solve the problem of coordinate transformation.
2.2.3 Drawing technique of body temperature map
The drawing of the body temperature map can be based on the relevant information of the patient in the body temperature list, and the corresponding body temperature curve can be drawn by using GDI+ of C#. In the program, the absolute coordinates and relative coordinates are first transformed, then the Pen class is used to define the brush, the Brush class is used to define the brush color, and the area to be filled is filled with a brush, and then the DrawLine method of the Graphics class is called to draw the desired Lines. In the DrawLine method, you need to provide parameters such as the brush type, the start and end coordinates of the line segment.
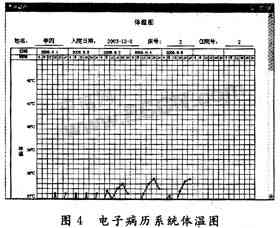
After the body temperature map is initialized, the database is queried according to the patient number passed from the thermometer as a global variable in the body temperature map, and the query result is converted into coordinates, and passed to the drawing methods DrawLine and FillEllipse to draw a graphic. Figure 4 is a body temperature diagram display interface.
2.2.4 Implementation of page turning in body temperature map
Since the body temperature map only displays the patient's temperature change information for one week at a time, to display the body temperature information one week ago, the page turning function can be used. The page turning function is mainly used to take advantage of the characteristics of the Read() method used when reading data. The current pointer is shifted down by 1 bit while reading data by the Read() method. Initially it is placed before the first row of the dataset, so the first call to Read() will place the pointer on the first row, making it the current row. As each call to Read() causes the pointer to move down, the dataset rows are fetched in order from top to bottom. code show as below: 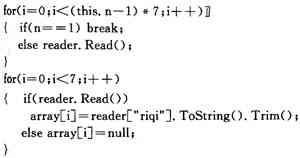
The variable n is a global variable, which is assigned by the page turning button. The current variable n is decremented by 1 by 7 for the number of intervals to be skipped. The date in the data set is filtered by date, and the date of the week is selected and stored in the array array.
3 Conclusion
Electronic medical records are an inevitable trend in the development of hospital information. According to the standardization requirements of HL7, the current research on electronic medical records in China is still not perfect. It is necessary to make more in-depth research to develop a more complete electronic medical record prototype system for domestic hospitals. This article explores the use of C# to draw the thermogram system of the electronic medical record system, trying to make a useful attempt to improve the electronic medical record system. The research content of the electronic medical record system will continue to develop and deepen, and the technical framework and software processes of the electronic medical record will become more and more mature.
Now it's easy to have a
magical star ceiling in your own home, with our high quality fiber optic star
kit. Unlike most companies offering star ceiling kits, we actually make our own
fiber and components, and our products are certified to exacting CE and ROHS
standards. So you can be sure you're getting the best!
Since we design and manufacture our own fiber optic products, our star ceilings
are higher quality than those offered elsewhere. As well as high quality
components, they come with mixed diameter fibers for a 3D 'near and far'
effect, and also have small fittings to give you a neat finish in the ceiling
or wall where you're installing the star lights.
Our fittings allow the fiber to pass all the way through to the other side of
the material, exposing the fiber end and covering up any ragged edges from
drilling. This allows more light through, giving you a more intense star
effect. The bare fibers can also be used on their own if you prefer.
Fiber Optic Star Effect Light,Star Ceiling Light,Ceiling Star Lights,Fibre Optic Ceiling Lights
ZHONGSHAN G-LIGHTS LIGHTING CO., LTD. , https://www.glightsled.com